Alcohol Consumption
United Kingdom
The Portman Group released in April 2011, a Fact Sheet stating
The UK’s alcohol consumption has fluctuated considerably over the past 100 years or so. In 1900 it stood at approximately 11 litres of pure alcohol annually per head of population. By 1950 it had dropped to below 4 litres. By 2000 it had risen again to over 8 litres and it currently stands at 8.9 litres.
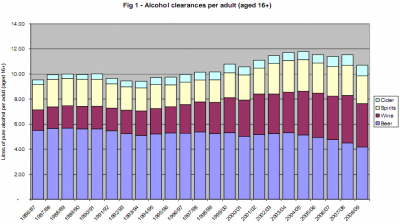
Changes in the proportion of children in the population may affect the per capita consumption figure; it is therefore useful to measure consumption per adult head of population. This currently stands at 10.7 litres.
This is based on tax receipts, rather than self-reported via consumer surveys. The chose the former since they consider self-reporting to be the less accurate measure (due to bias due to under-reporting for example.)
They also show that average consumption in the UK over 23 years since 1986 (-2009) has remained fairly static, peaking in 2004/5 and declining since:
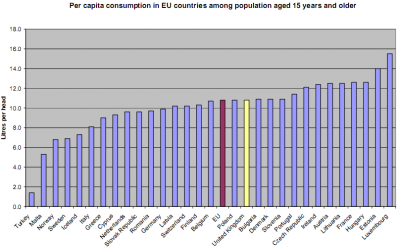
They also show that UK consumption is mid-range compared to the rest of Europe:
The trend has continued into 2011
New figures for UK alcohol consumption in 2011 show that the amount Britons drink has fallen yet again – for the fifth year out of the past seven.
Consumption per head is now 13% lower than it was in 2004 when the current trend began, says the British Beer & Pub Association, which has compiled the new data based on HMRC alcohol tax returns.
The figures confirm trends unveiled yesterday by the Office of National Statistics, which also show that binge drinking is falling across all categories of drinkers, by sex and age.
Drinking above weekly guidelines among young men, for example, is down from 32% to 21% compared with five years ago.[1]

